Information about thermal imaging of asphalt paving
Compiled by Conny Andersson CA Konsult
Thermal imaging
The journey with the infrared camera started in 1988.
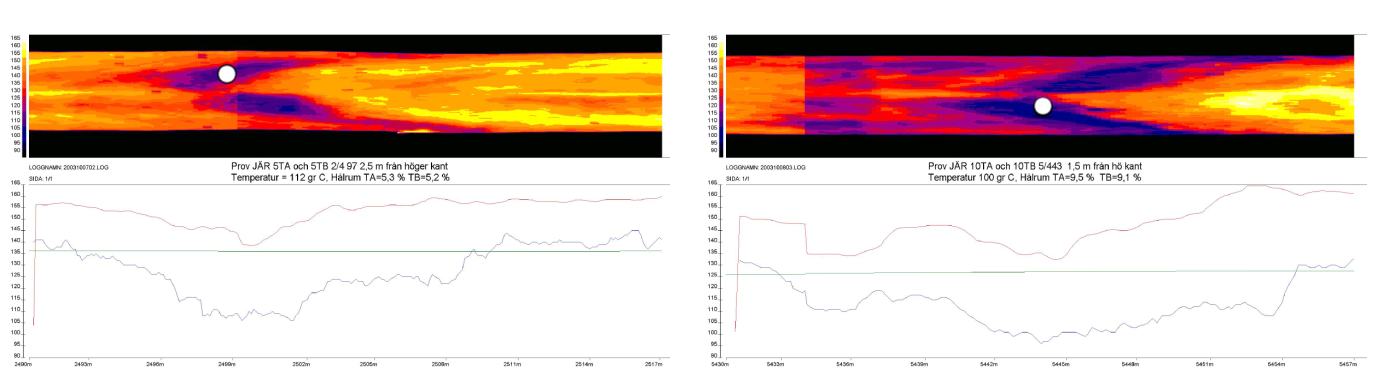
10 randomly chosen objects were tested. All showed large variations in temperature, up to 60°C, behind the paver.
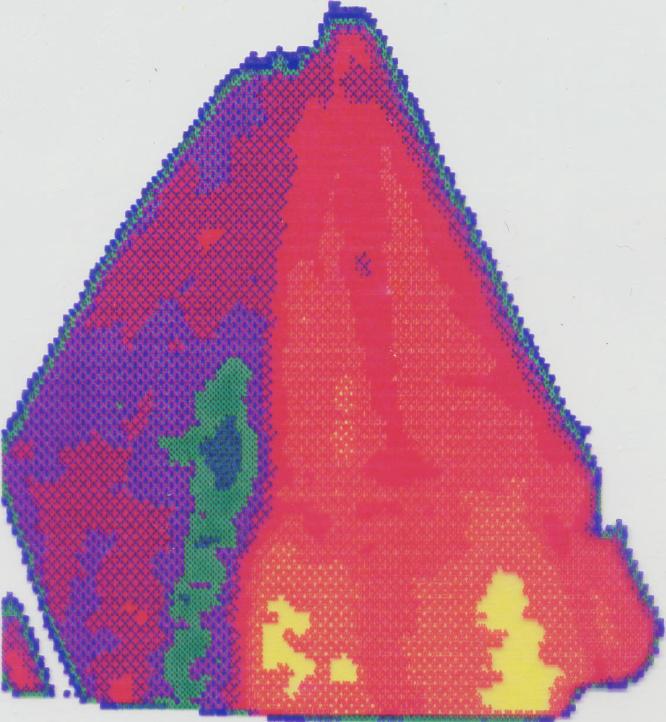
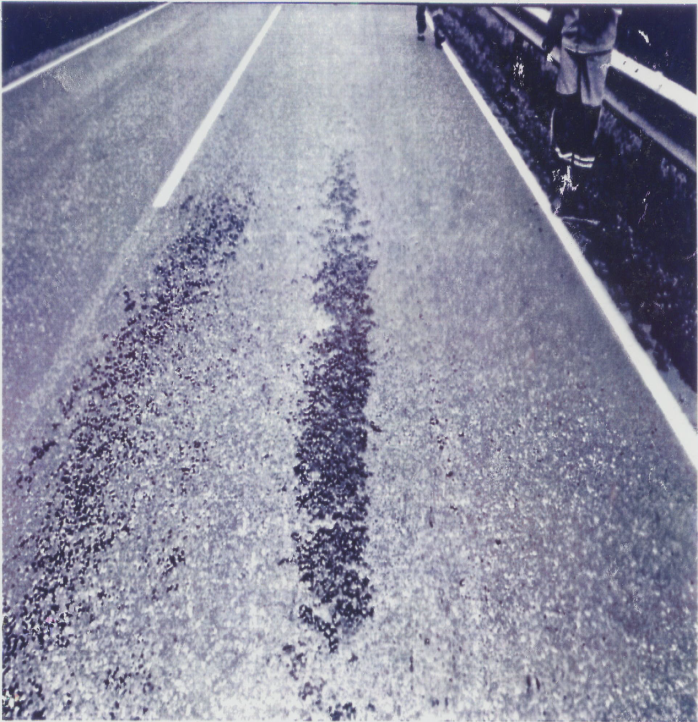
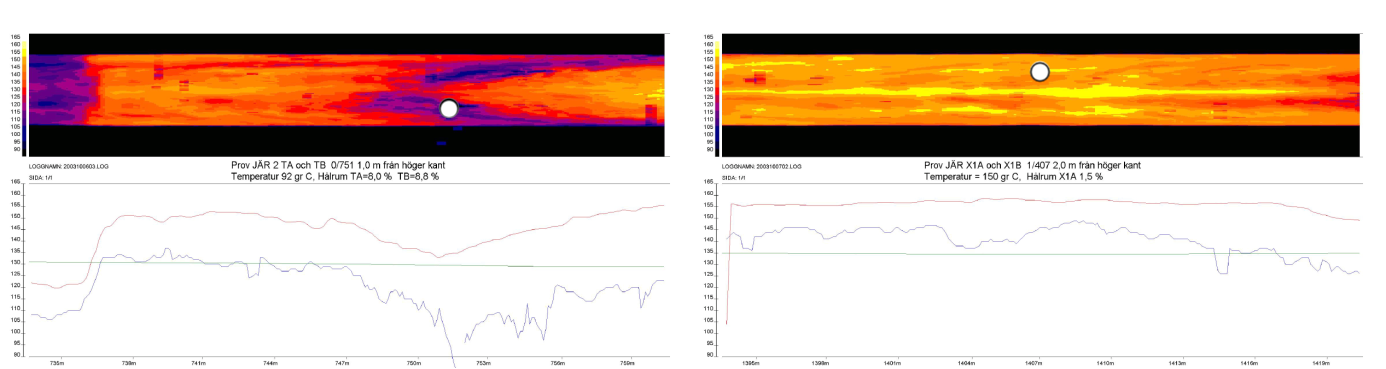
The pictures below show thermal image year 0 and visual image in year 1.
Drilled Samples year 0 showed high void and segregated grain curve.
The visual image after one winter is produced by rain. The surface of relatively lower temperature indicates a slower drying. This creates a risk of aging of the bitumen and frost shattering during the winter with consequent stone drop.
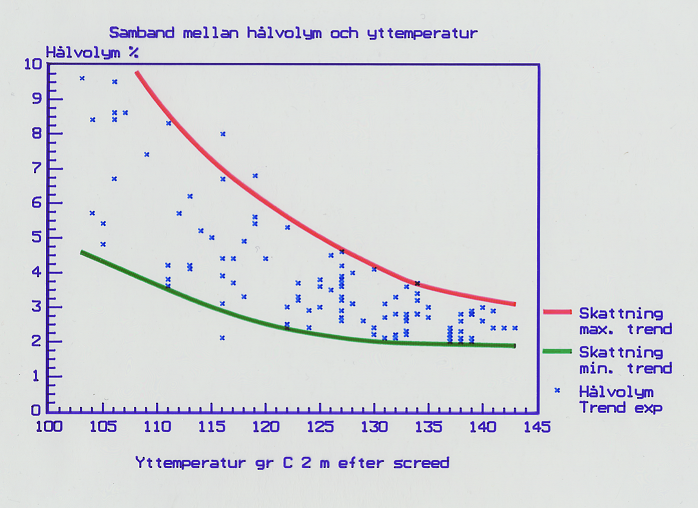
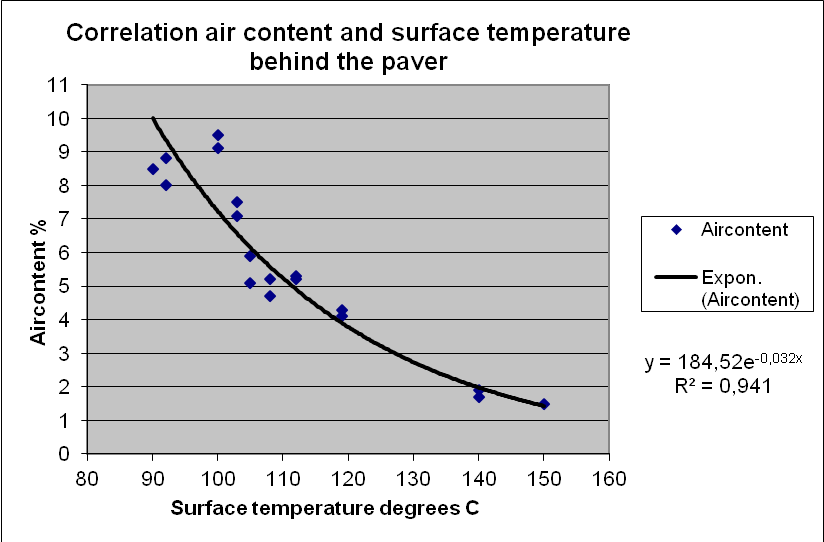
The first test of the correlation air content and surface temperature behind the paver in 1988 :
Evaluation of IR-Thermograpy 1991
All measurements in the period 1988-1991 revealed a risk of poor compaction and damage at relatively low temperatures.
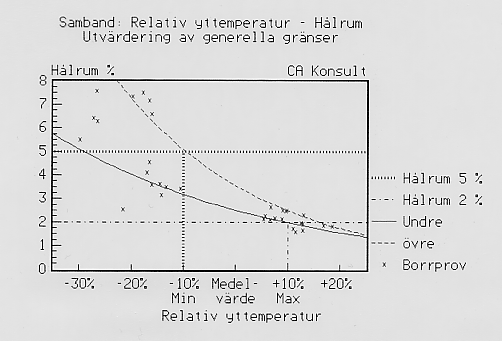
In 1991, the Swedish Transport Administration gave CA Konsult a mandate to evaluate and set boundaries.
It was chosen to put 40 cores on 4 x 100 meter distances during two days of production. The distribution of the samples were done with 50% low temperatures and 50% remained high.
Since the temperature level was varied between tests with up to 25°C, CA elected to prepare the material of the percentual distance from temperature averages of 100 meters .
The limits were added to the average temperature of ±10%. In practice, only an average of -10% has been used since the stone drop has been the priority. In the distance average temperature +10%, we found frequent items with risk of deformations.
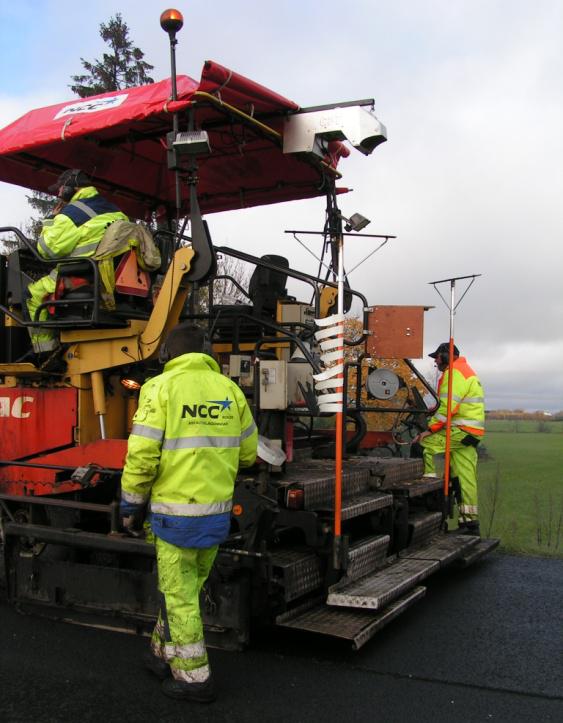
Infrared Line Scanner
The design called GPTux (Global Positioning Thermography with Linux) works with an Infrared Line Scanner.
The Line Scanner maximizes measurement accuracy by using the same detector for all measurements. It also covers a large measurement width by measuring 90 degrees in one revolution.
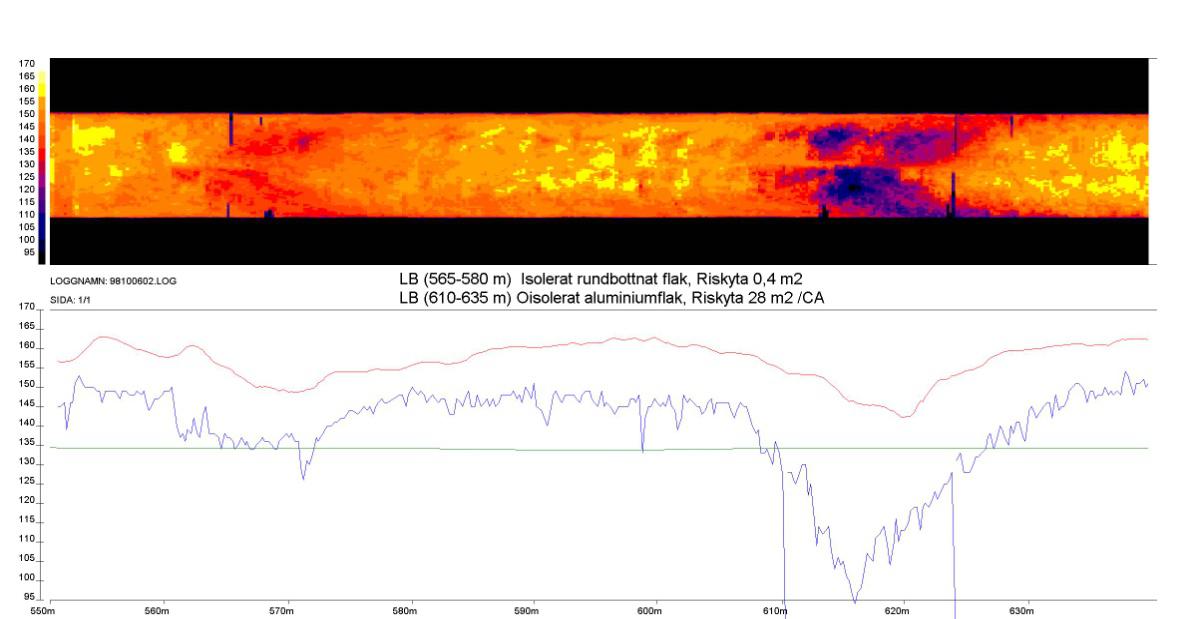
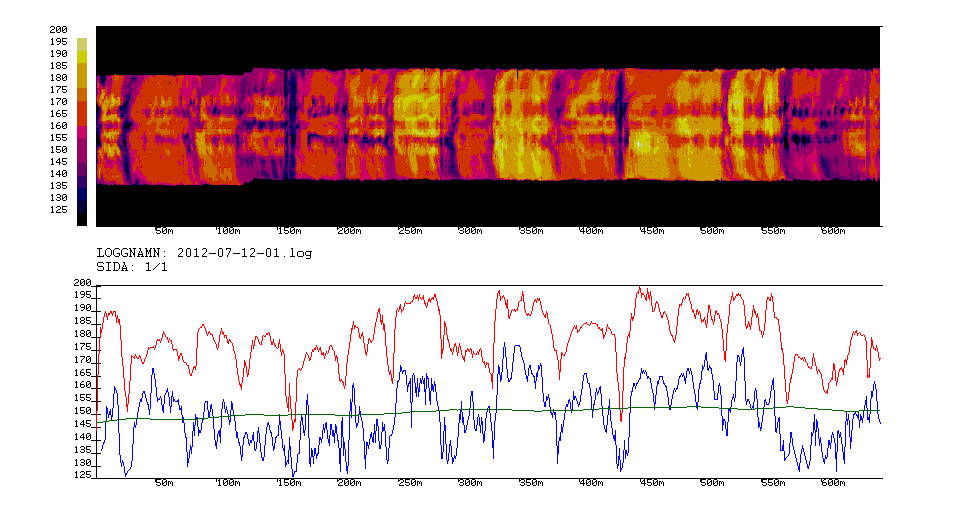
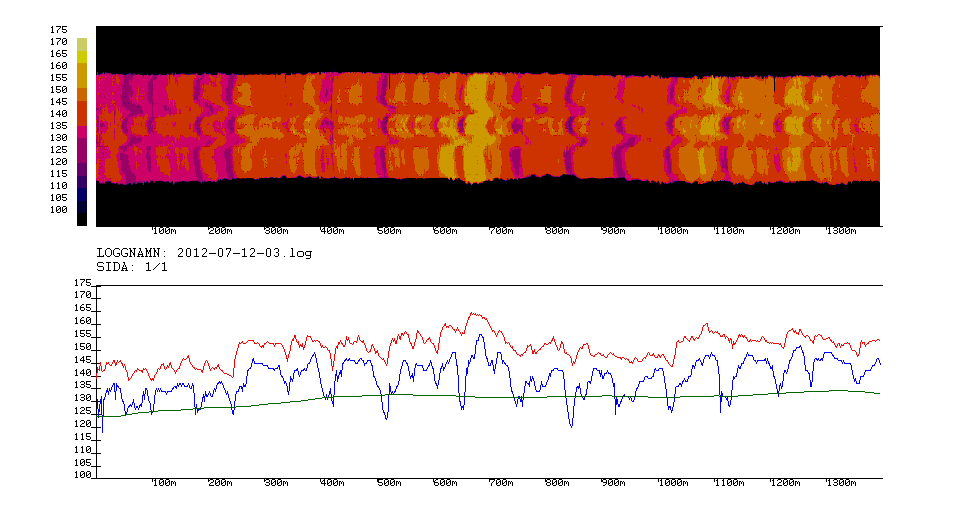
Thermal Map
From the logged data a thermal map can be produced. The colors represent a temperature range of 5°C per color. The black color represents temperatures below 95°C and is the area outside the paving.
The graph shows the maximum and minimum temperatures and the green line is a risk zone for poor compaction and future damage. It is estimated as 90% of the floating average, equivalent boundary from the above evaluation.
Trucks
The truck change in the left side of the picture after 560 meters was carried out by a round bottom platform with insulation and a perfect loading technology. Risk area was only 0.4 m².
The truck change to the right after 610 meters was carried out by a conventional flatbed in aluminum without insulation. Risk area was 28 m², which corresponds to about 2.5 tons.
Round bottom platform with insulation

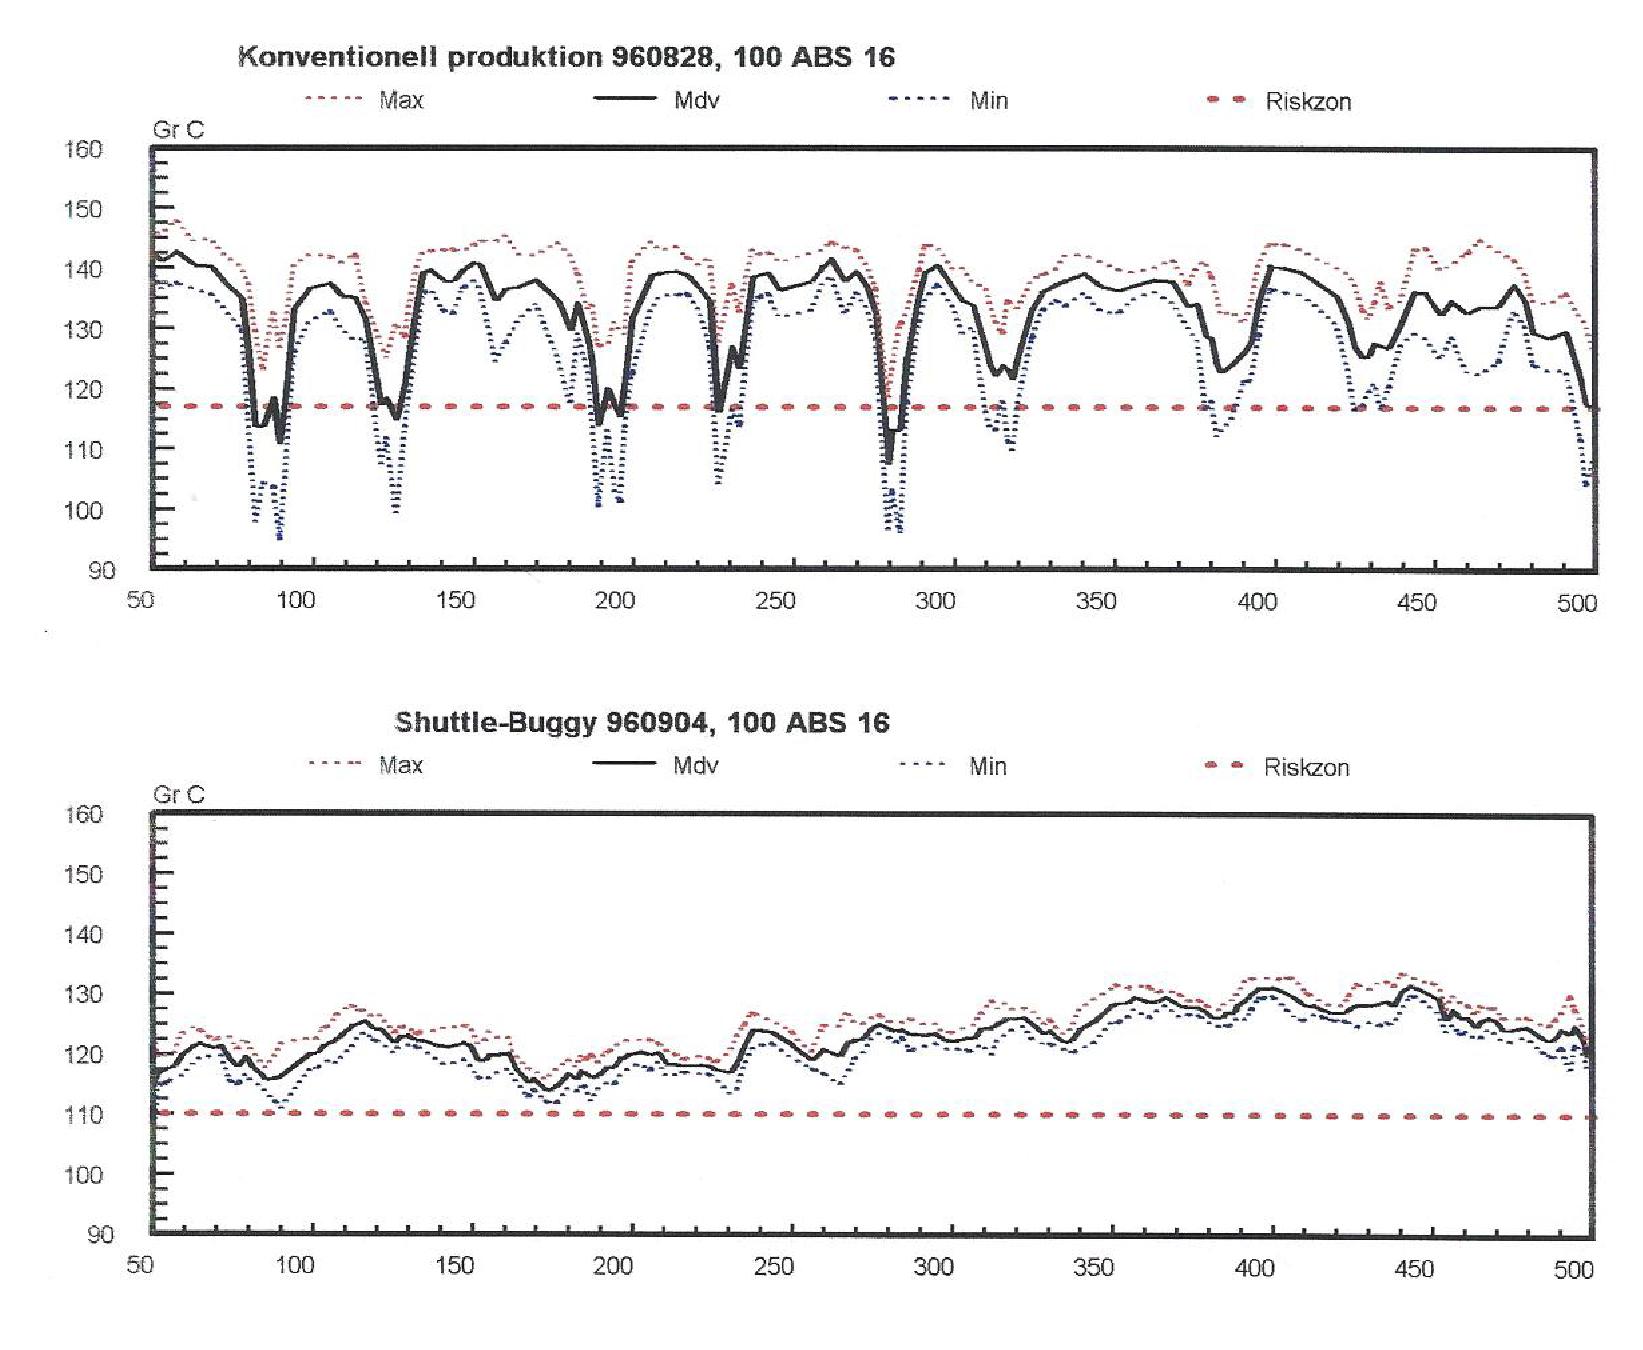
Feeder
Feeder in the form of Shuttle Buggy was introduced by Skanska in Sweden 1996. CA Konsult was commissioned to evaluate its effect on asphalt paving using infrared measurement.
The results of the measurements showed without a doubt that the homogenization and the possibility of continuous operation could increase the life of the wearing course with 10-15%. It was difficult to make an evaluation if life increased in the underlying layer. It is clear that the compaction is very important for the stability of the roadway. If chilled asphalt can be avoided when changing the trucks, the risk of poor compaction will be minimized.
Bonus system
At this time there was no available option for Swedish Transport Administration to pay the additional cost of the equipment, even if it could be proved that there was value in the process. Delivery of homogeneous paving was already written into the contract.
In 1997-1998, CA Konsult developed and commissioned by Transport Administration Stockholm a system of bonuses with infrared measurement as base. In 2007 was a penalty in risk factor > 5% introduced.
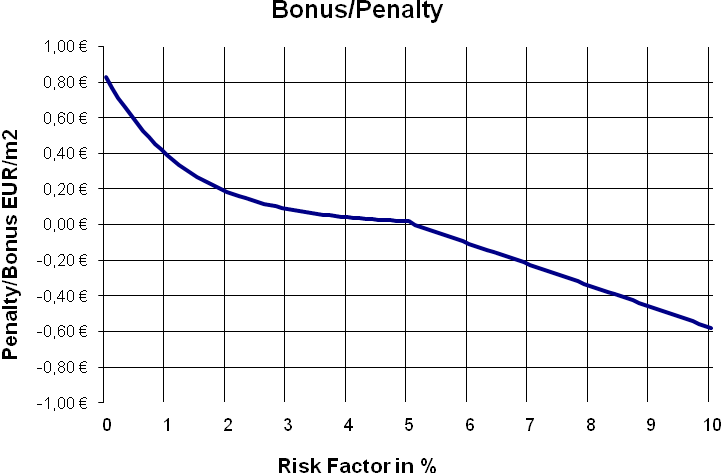
The intention of the system is to give the authorities the opportunity to pay for the added value that feeder and other efforts entrepreneurs create. Can a bonus be payed, the market will be interested in machine development.
Targeted testing
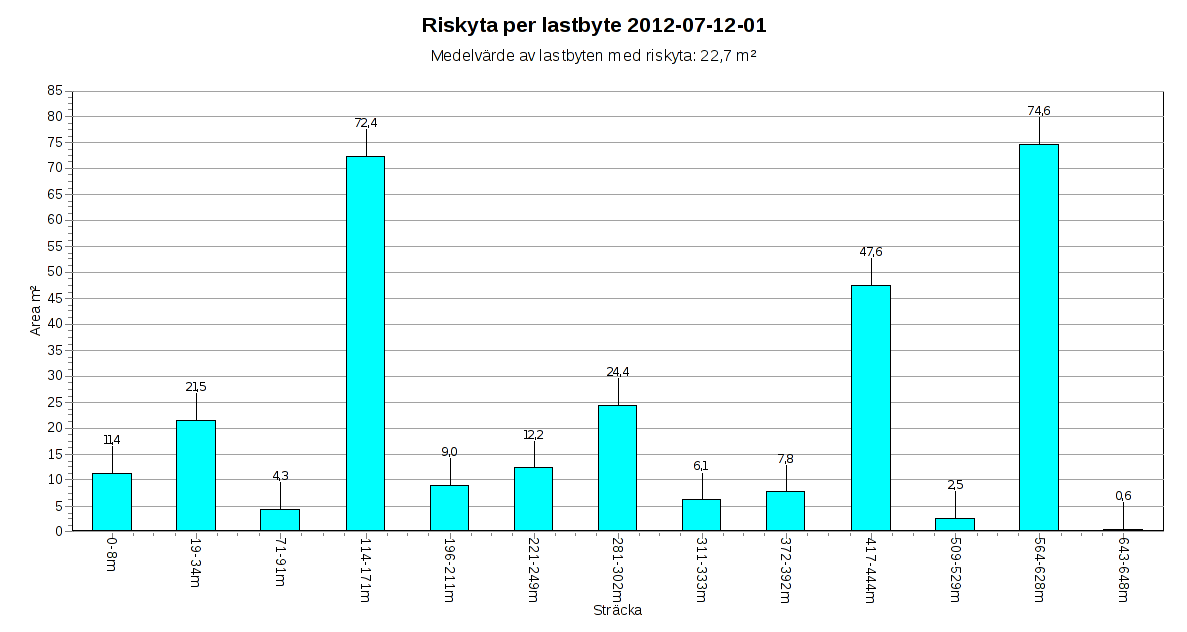
Random targeted tests were performed to see if the distinction is relevant. The table below shows an example for ABS 16 from 2003.
Extremely poor performance, ABS 16 wearing course
Risk Factor 11.02%
Risk area per load change in square meters, average 22.7 m²
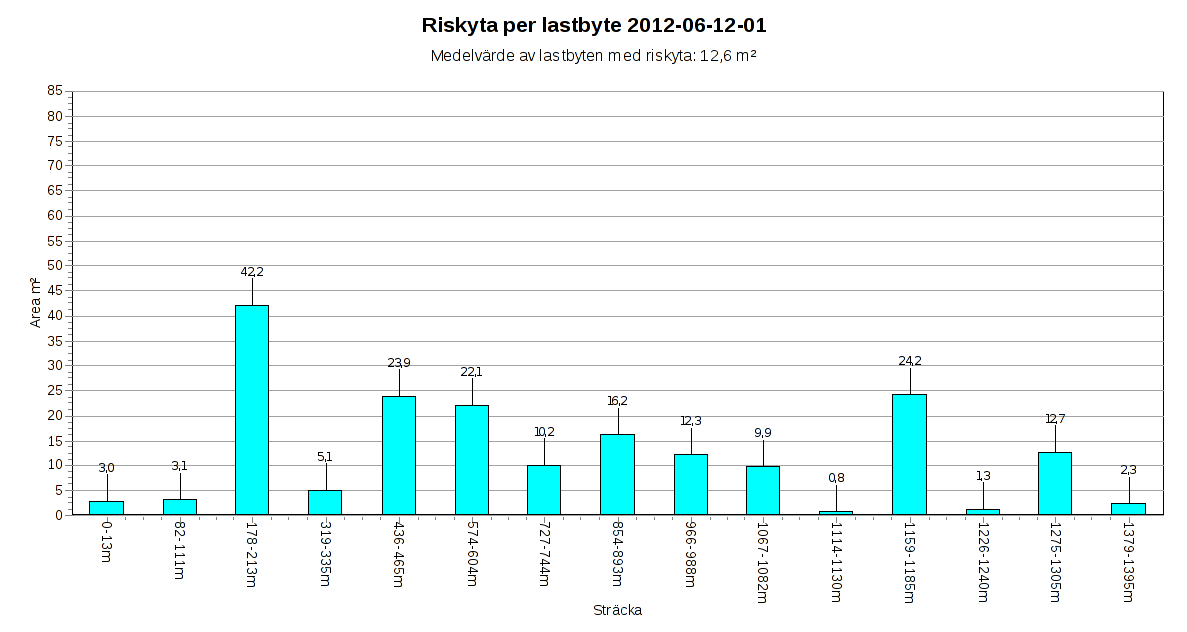
Poor performance, ABS 16 wearing course
Risk Factor 6.05%
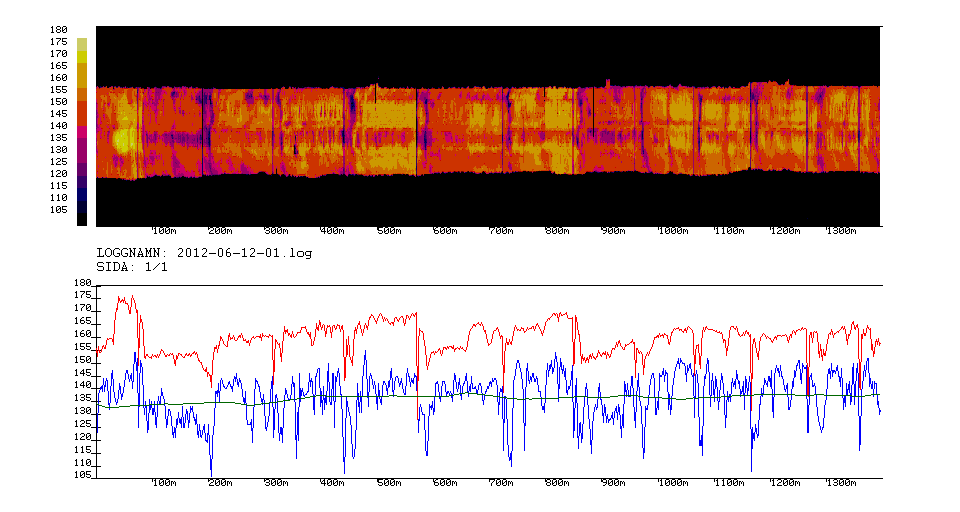
Risk area per load change in square meters, average 12.6 m²
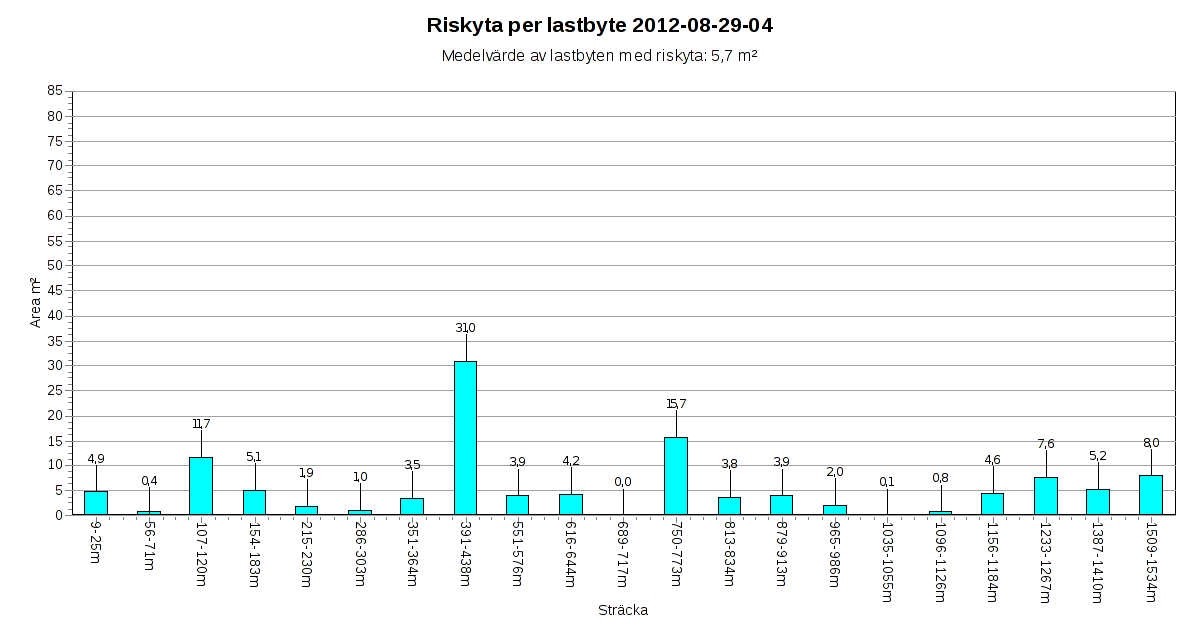
Middle performance, Silent asphalt wearing course
Risk Factor 2.36%
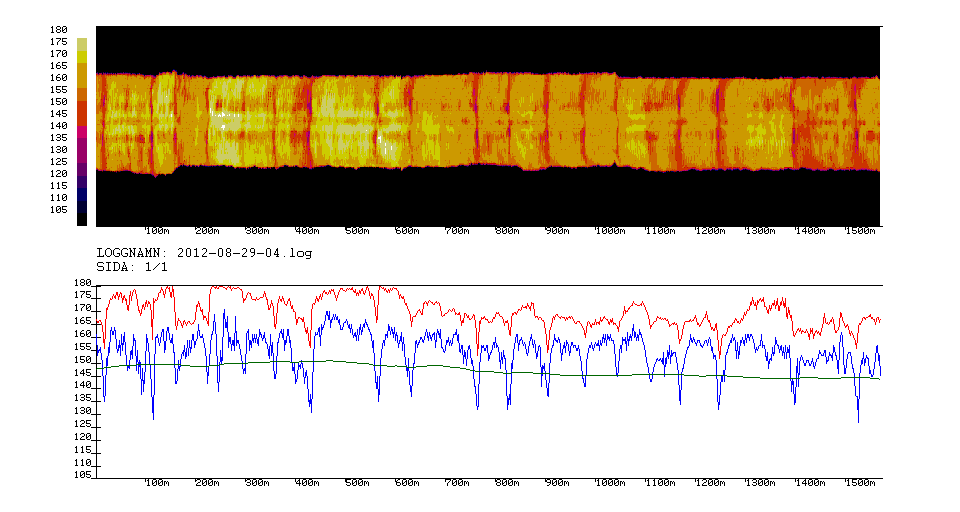
Risk area per load change in square meters, average 5.7 m²
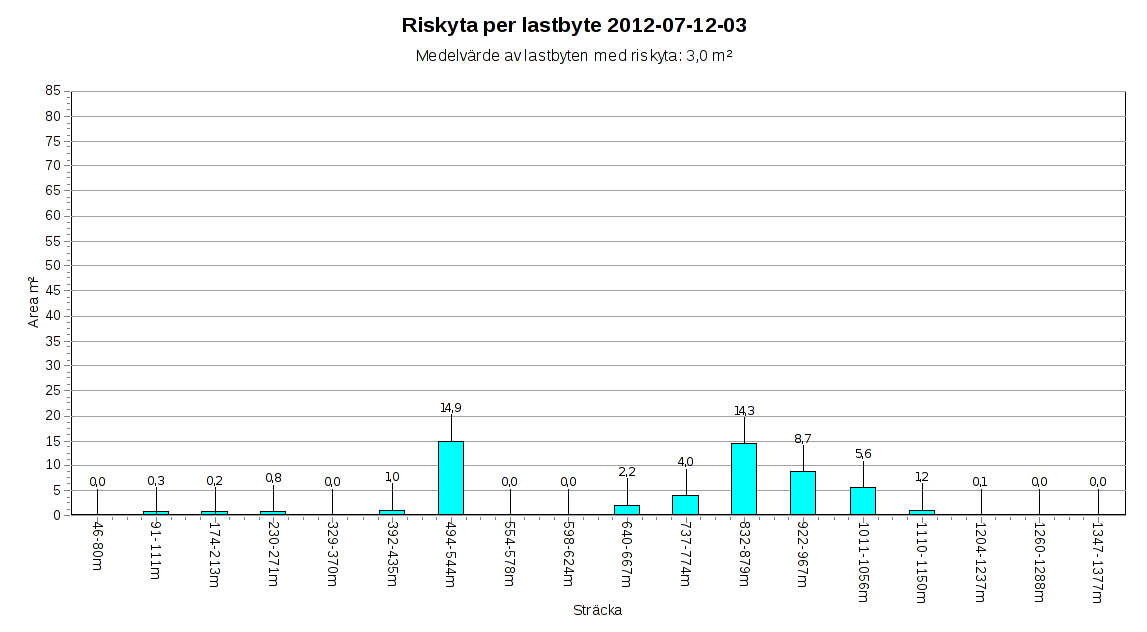
Feeder, good performance, ABS 16 wearing course
Risk Factor 0.93%
Risk area per load change in square meters, average 3.0 m²
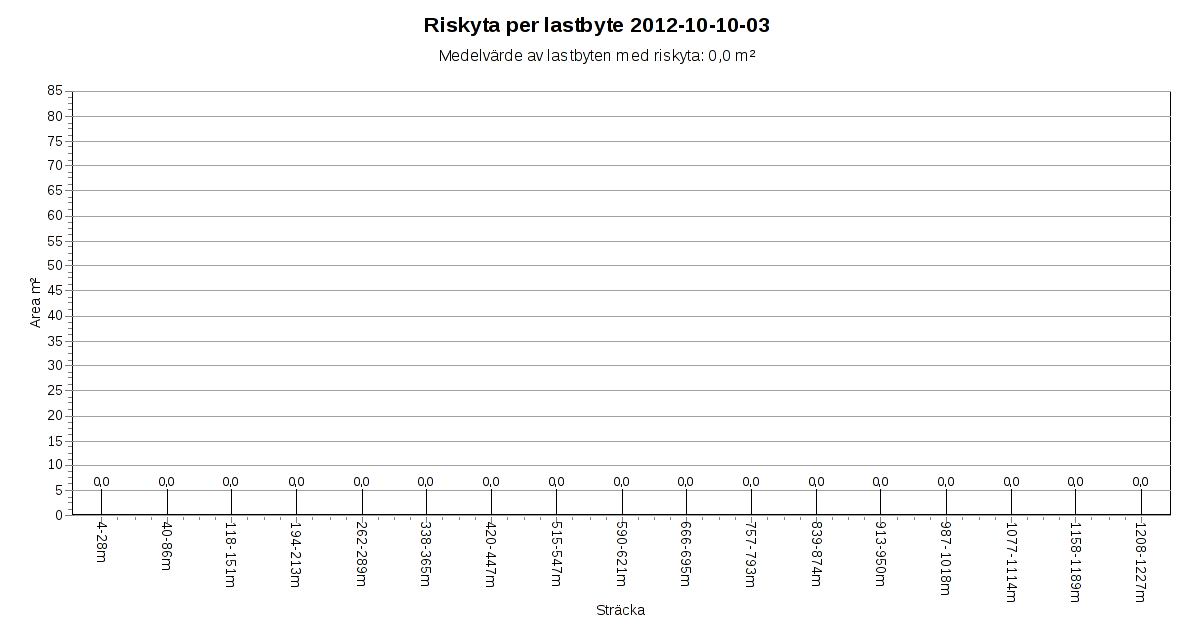
Feeder, excellent performance, ABS 16 wearing course
Risk Factor 0.00%
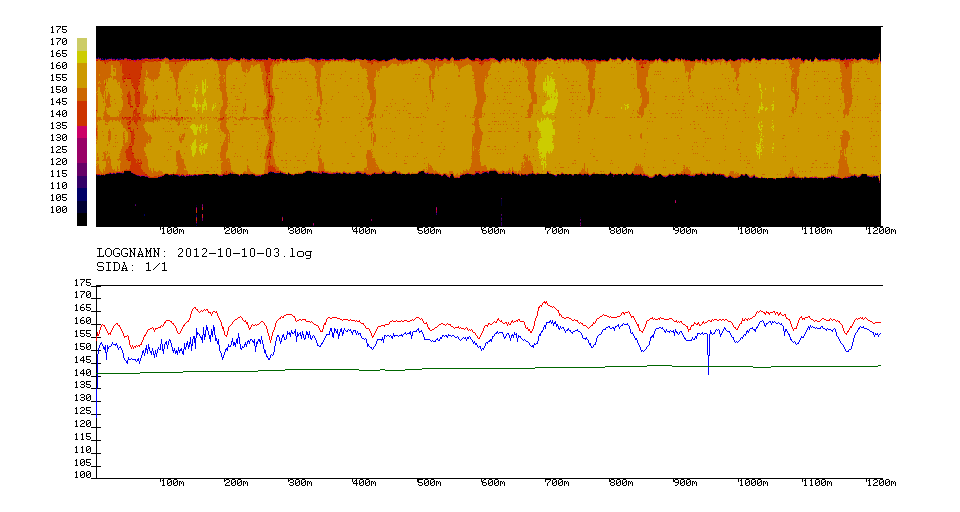
Risk area per load change in square meters, average 0.0 m²